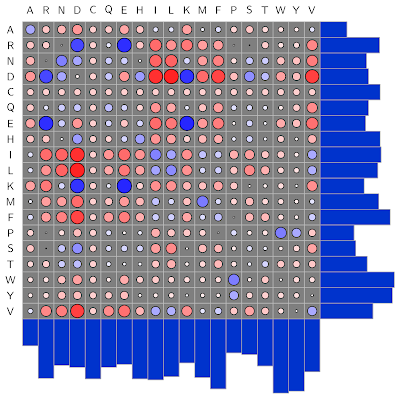
A few months ago I wrote a post about amino acid interactions. It showed how much the different amino acids like to be in contact with one another. Now, in celebration of my upcoming paper in Chemical Science, I've updated the figure for surface interactions. It is shown below.
This new plot again shows the strength of interactions between amino acids with the colored circles. The diameter represents the strength of the interaction and blue indicates a favored interaction. Red indicates an unfavored interaction. These are for interactions on surface residues, so these are more for understanding protein-protein interactions and not necessarily protein folding. The bars on the edge of the plot are the unique part of this plot. They show the probability that an amino acid is interacting. So, for example, a key conclusion of my paper was that lysine rarely interacts and when it does, it interacts with residues likely found on the surface. That may be seen in the K bars on the edges of the plot, which are low relative to the others. Anyway, this plot is pretty interesting because it shows both how often an amino acid interacts and with which other amino acid it likes to interact. More information about the dataset of proteins and why the surface amino acids matter can be found in the publication in Chemical Science. Briefly, I was able to copy patterns I found on the surface of proteins to mimic them with a synthetic material. One of the most interesting outputs from the research was the plot I'm showing, but it wasn't directly related to the paper. So, I hope you all enjoy seeing it here.
This new plot again shows the strength of interactions between amino acids with the colored circles. The diameter represents the strength of the interaction and blue indicates a favored interaction. Red indicates an unfavored interaction. These are for interactions on surface residues, so these are more for understanding protein-protein interactions and not necessarily protein folding. The bars on the edge of the plot are the unique part of this plot. They show the probability that an amino acid is interacting. So, for example, a key conclusion of my paper was that lysine rarely interacts and when it does, it interacts with residues likely found on the surface. That may be seen in the K bars on the edges of the plot, which are low relative to the others. Anyway, this plot is pretty interesting because it shows both how often an amino acid interacts and with which other amino acid it likes to interact. More information about the dataset of proteins and why the surface amino acids matter can be found in the publication in Chemical Science. Briefly, I was able to copy patterns I found on the surface of proteins to mimic them with a synthetic material. One of the most interesting outputs from the research was the plot I'm showing, but it wasn't directly related to the paper. So, I hope you all enjoy seeing it here.
